Understanding the carbon footprint of coffee and how to reduce it
What is a carbon footprint?
Everything we consume has a carbon footprint (CF); the amount of carbon dioxide (CO2) emitted within every step of a product’s lifecycle. It is typically measured in kilograms of CO2 per unit area, volume, weight, and/or time, etc. CFs usually measure just carbon emissions and not net carbon flow. Therefore, they don’t provide much insight into other environmental impacts of production – such as deforestation, biodiversity loss, and water pollution – or the ability of a production system to store carbon. Carbon storage refers to plants sequestering CO2 from the atmosphere into their vegetative structures. Polyculture coffee systems (those growing more than one crop) can store high amounts of carbon while shaded and unshaded monoculture systems offer low carbon storage.
What contributes to the carbon footprint of coffee?
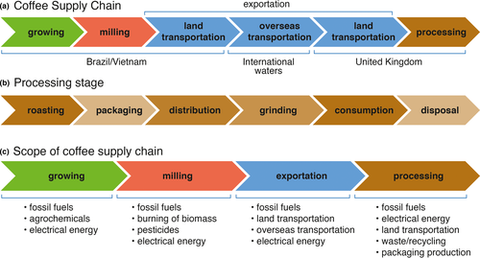
Coffee’s CF includes processes like growing, milling and post-harvest processing, transportation, post-export processing, and consumption. Coffee’s CF can vary widely, depending on factors such as the study methodology and country of origin (such as in these studies from Japan, Thailand, Finland, and Costa Rica). We’ll look at one study to exemplify how coffee’s CF can be calculated:
Coffee’s CF includes processes like growing, milling and post-harvest processing, transportation, post-export processing, and consumption. Coffee’s CF can vary widely, depending on factors such as the study methodology and country of origin (such as in these studies from Japan, Thailand, Finland, and Costa Rica). We’ll look at one study to exemplify how coffee’s CF can be calculated:
A 2020 study, “Life cycle assessment synthesis of the carbon footprint of Arabica coffee,” calculated the CF of coffee produced in Brazil and Vietnam and exported to the United Kingdom. Brazil and Vietnam were chosen as countries of origin since they are the two largest coffee-producing countries, together producing over 50% of the world’s Arabica coffee. The study averaged the CFs of the two countries to find the average footprint for conventional and sustainable coffee systems. We won’t talk about their calculation for conventional coffee* besides that it was 36 and 22 times higher than the CF of sustainable production in Brazil and Vietnam, respectively. This reduction in CF for sustainable coffee was due to exporting/importing via cargo ship instead of air freight, and the elimination of agrochemical inputs.
The average CFvof sustainably-produced Arabica coffee from both countries was 3.51 kg of CO2 equivalent per 1 kg of green coffee (kg CO2e kg−1). The CF of sustainable coffee, in comparison to other highly-traded agricultural products, is relatively low:
Beef = 27 kg CO2e kg−1
Cheese = 13.5
Tea = 7.1
Wine = 1.72
Sugar = 0.55 kg
Cheese = 13.5
Tea = 7.1
Wine = 1.72
Sugar = 0.55 kg
Growing
Quantifying carbon emissions, particularly at the farm level where data are scarce, is quite difficult. One thing is certain; agriculture is one of the most important sectors influencing climate change because production systems can act as either a positive or negative source of greenhouse gases. Production systems with woody perennial species, such as coffee plantations, can mitigate global warming because of their ability to sequester carbon in biomass and soil. Let’s take a momentary tangent to look at a 2014 study in Colombia that assessed the CF of coffee plantations in monoculture and in agroforestry systems with Spanish elm: the Spanish elm agroforestry system sequestered a net of 14.2 Mg CO2e/hectare/year, while the coffee monoculture emitted 5.7 Mg net CO2e/hectare/year. Growing shade trees on farms can change a coffee plantation from a source of greenhouse gases to an atmospheric purifier.
Back to the current study; growing was responsible for only 1–2% of the total CF of sustainably-farmed coffee. Swapping chemical fertilizers in conventional systems for organic fertilizers in sustainable systems reduced emissions. The use of organic waste as fertilizer and lack of pesticides made fossil fuel use and electricity use the largest emission sources in the growing phase.
Milling
After the coffee fruit is harvested, milling and on-farm processing involve pulping, fermenting, washing, and drying the beans. Milling was responsible for only 2–3% of the CF, and in this phase, fossil fuel use was the largest emission source.
Transportation
Coffee is almost exclusively grown in economically-developing countries but is largely consumed by economically-developed countries. In fact, the European Union and the United States import 2/3 of coffee produced worldwide. The significant distance from farm to cup means a great deal of carbon is emitted in the transportation phase; roughly 15% of greenhouse gas emissions in coffee’s lifecycle can be attributed to international transportation.
This study calculated that exportation was responsible for 6–11% of total CO2e emissions, with most emissions coming from cargo ship transport.
Processing
Finally, post-export processing included roasting, packaging, distribution, grinding, consumption, and disposal. The processing phase was by far the largest source of CO2e emissions, contributing 91% of the CF in Brazil and 84% in Vietnam.
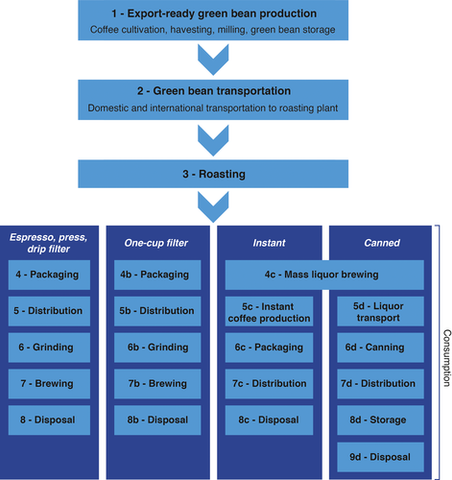
Emissions coming from coffee consumption vary depending on the brewing method. The primary consumption emissions in this study came from factoring in electricity used by automatic coffee machines, which generate about 60.27 g CO2e per cup of coffee. In comparison, traditional filter drip and French press methods generate approximately 10.04 g.
So, what’s the carbon footprint of my latte?
This study assumes a drink contains 18 g of green coffee, which was calculated to produce an average CF of 0.06 kg CO2e per espresso beverage made with sustainable coffee.
Considering the CF of dairy milk (note that animal products often have high CFs), the CFs for one latte, flat white, and cappuccino were estimated to be 0.33, 0.13, and 0.20 kg CO2e, respectively.
Ways to reduce the carbon footprint of coffee
Given that the main sources of carbon emission in this study were during the post-exportation processing phases, roasters and consumers should feel empowered to reduce their emissions.
Roasters can take steps such as reducing packaging and using more eco-friendly package materials, using energy-efficient roasters and renewable energy throughout their facilities, and focusing on fuel-efficient shipping.
Consumers and coffee shops can look for energy-efficient coffee machines, or use other eco-friendly brewing methods. We can all compost our coffee grounds, and buy our coffee from farms that use regenerative agriculture, agroforestry, and/or organic farming.
-
*We focused on sustainable coffee because 1) Groundwork uses sustainable practices in every stage of production possible for us, and 2) nearly all carbon footprint assessments (including the studies from Japan, Thailand, Finland, and Costa Rica) assume cargo ships as the method of exportation. This is in fact the most common method of transportation. Curiously, the current study assumes that many roasters, in pursuit of fresher coffee, are importing coffee via air frieght. These freight flights release around 100x more CO2e per km traveled than cargo ships.
Written by
Melina Devoney
Barista, Coffee Captain, Blogger